
Introduction
The market’s crashing, your palms are sweaty, and suddenly—a tiny star flickers on your chart. No, it’s not astrology. It’s the star candlestick, a pattern that’s saved traders from financial oblivion since 18th-century rice traders sketched it on parchment. Whether you’re battling crypto volatility or juggling blue chips, the star candlestick is your North Star for spotting reversals. But most traders blow it by acting too late—or too soon. Here’s how to decode this candlestick like a pro, with 5 secrets Wall Street won’t teach you.
1. What is a Star Candlestick? (And Why It’s Your Lifeline)
A star candlestick isn’t just a pretty shape—it’s a market scream for help. This pattern has:
- A small body (bullish or bearish) gapping away from the prior candle.
- A short upper/lower wick (like a star twinkling in chaos).
- Follows a strong trend, signaling exhaustion.
Found at the top of rallies or bottom of sell-offs, this candlestick screams, “Trend’s dying!” Think of it as the market’s SOS flare before a U-turn.
2. Spotting a Real Star Candlestick (Most Are Fake)
Not every gap is a star candlestick. Here’s how to filter the noise:
- The Gap: Prices must jump from the prior candle’s close (no overlap).
- Trend Context: Must follow a steep rally or plunge.
- Confirmation: Next candle should reverse the trend.
Example: In April 2024, NVIDIA (NASDAQ: NVDA) printed a bearish star candlestick after a 40% rally. The next day’s red candle confirmed the top—NVDA dropped 15% in a week.
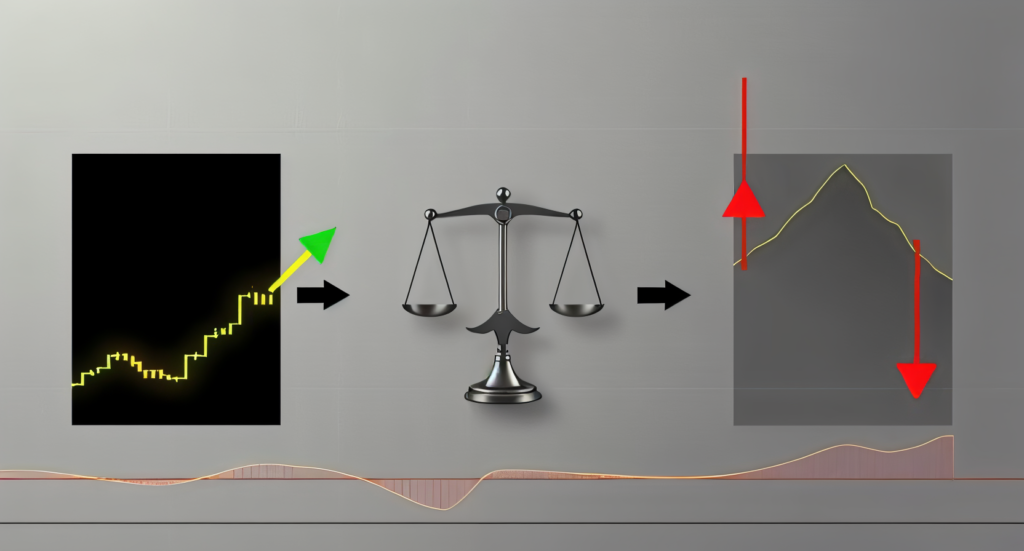
3. The Psychology Behind the Star Candlestick
The star candlestick is pure trader panic. Here’s the drama:
- Bulls/Bears push prices to extremes.
- The gap opens, but momentum dies—no follow-through.
- The small body? That’s the market gasping for air.
It’s a warning: the star candlestick is the moment bulls or bears realize they’re out of ammo.
4. Star Candlestick vs. Doji vs. Shooting Star
Don’t confuse the star candlestick with its cousins:
- Doji: Neutral, no body—indecision, not reversal.
- Shooting Star: Same as a bearish star candlestick but no gap. Less reliable.
- Morning/Evening Star: Multi-candle patterns with this candlestick as the core.
Pro Tip: A star candlestick needs a gap. No gap? It’s a poser.
5. 5 Proven Strategies to Trade the Star Candlestick
Strategy 1: The Gap-and-Trap Play
this candlestick after a 3-day trend? Wait for the next candle to close against the trend—then strike.
Strategy 2: Pair with Volume Divergence
Spot a star candlestick with plunging volume? Bulls/bears are tapped out.
Strategy 3: Fibonacci Finale
Use this candlestick at key Fib levels (78.6% retracement) for surgical entries.
Strategy 4: Options Insurance
Buy puts/calls after a star candlestick, hedging with the opposite position 2% away.
Strategy 5: Multi-Timeframe Confirmation
Daily star candlestick? Check weekly charts for alignment—no conflicting trends.
6. 3 Deadly Mistakes with Star Candlesticks
- Ignoring the Gap: No gap = not a star candlestick.
- Premature Entries: Wait for confirmation—patience pays.
- Overlooking Volume: Low volume = weak signal.
7. Real-World Star Candlestick Wins
- Bitcoin (2023): A bearish star candlestick at $31k signaled a 25% crash.
- Tesla (2022): A bullish star candlestick at $180 sparked a 120% rally.
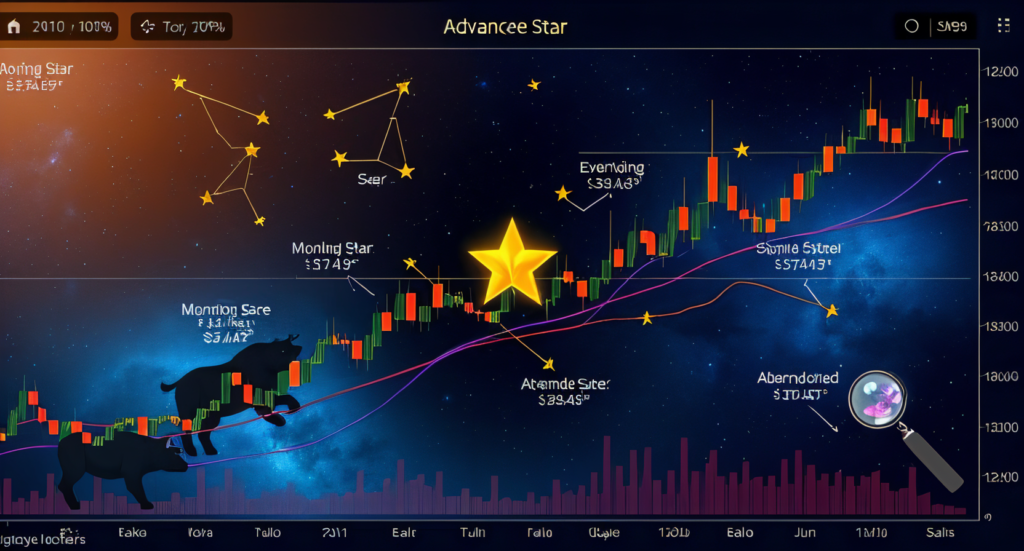
8. Advanced Variations: Beyond the Basic Formation
While the classic stars candlestick is a solo act, its power amplifies when paired with other patterns. Consider these advanced setups:
- Morning Star: A three-candle bullish reversal. After a downtrend, a bearish candle is followed by a small-bodied star candlestick (the “star”), then a bullish candle closing above the midpoint of the first candle. This trio signals a sunrise after market darkness.
- Evening Star: The bearish counterpart. A bullish candle, followed by this candlestick, then a bearish candle closing below the first candle’s midpoint. Think of it as dusk before a market nightfall.
Example: In 2023, silver formed an Evening Star cluster at $26/oz. The third candle’s plunge confirmed the top, leading to a 20% drop.
Pro Tip: These multi-candle patterns reduce false signals—ideal for traders craving precision.
9. Combining with Indicators: Turbocharge Your Edge
A lone star candlestick is a flashlight; paired with indicators, it’s a spotlight. Here’s how to merge them:
- RSI Divergence: Spot this candlestick during overbought (70+) or oversold (30-) RSI readings. In 2022, Amazon’s bearish star at $170 aligned with RSI divergence, foreshadowing a 25% collapse.
- Bollinger Bands: this candlestick touching the upper/lower band hints at reversals. Bitcoin’s 2024 rally peaked with a bearish star at the upper Bollinger Band ($52k), followed by a 15% correction.
- MACD Crossovers: Wait for the MACD line to cross the signal line after this candlestick. Gold’s 2023 bullish star at $1,800, paired with a MACD bullish crossover, ignited a 12% surge.
Rule: Never rely solely on the pattern—context is king.
10. Historical Case Studies: Lessons from the Trenches
This candlestick isn’t new—it’s survived centuries of market chaos. Let’s time-travel:
- 2008 Oil Crash: A bearish Evening Star at $147/barrel signaled the end of oil’s historic rally. Prices cratered 75% in months.
- 2015 EUR/USD Plunge: A Morning Star at 1.0450 marked the euro’s floor against the dollar, preceding a 15% recovery.
- 2021 GameStop Frenzy: A bearish star at $483 (daily chart) coincided with peak retail mania. The stock collapsed 90% in weeks.
Takeaway: This formation thrives in extremes—panic or euphoria.
11. Common Misreads: When the Pattern Lies
Even pros get duped. Avoid these traps:
- Gap Illusions: Stars candlestick needs a true gap (no overlap with prior candle). Forex “gaps” over weekends don’t count.
- Low-Volume Stars: Stars candlestick on thin volume? Noise, not signal. Check volume against the 30-day average.
- Index vs. Stock: Stars candlestick in the S&P 500 may not apply to individual stocks. Always cross-verify sector trends.
Case Study: In 2024, Tesla formed a bullish star at $150, but with volume 40% below average. The “reversal” fizzled, trapping bulls.
12. Tools to Automate Detection
Why hunt manually when tech can help? Top tools to spot this candlesticks:
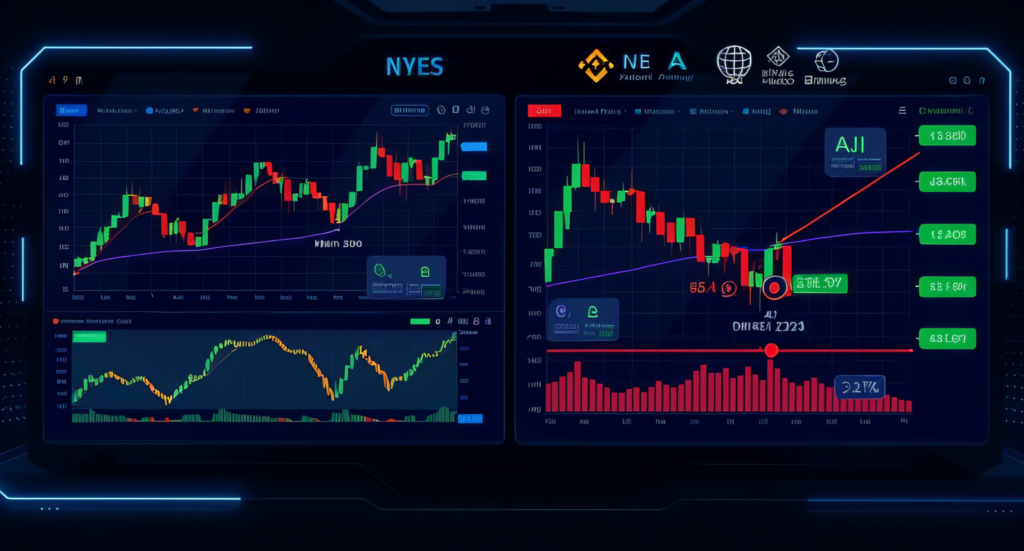
- TradingView Alerts: Custom scripts ping you when stars candlestick forms on your watchlist.
- MetaTrader’s Pattern Scanner: Auto-detects Morning/Evening Stars across timeframes.
- Finviz Elite: Scans 1000s of stocks for gap-based patterns daily.
Cost Tip: Free tools like StockCharts.com offer basic pattern screening—start there.
Conclusion
The star candlestick isn’t a crystal ball—it’s a flare gun. Master these 5 secrets, avoid rookie traps, and you’ll turn this ancient pattern into a modern edge. The next time this candlestick flickers on your chart, remember: fortune favors the prepared.