
You’re staring at a stock chart, and suddenly, it clicks: those red and green bars aren’t random squiggles—they’re stories. Stories of greed, panic, and hidden opportunities. For 400 years, traders have used candlestick patterns to decode market psychology and predict price moves. But here’s the twist: most newbies use these patterns wrong. They chase “bullish hammers” like lottery tickets, only to get crushed by a trapdoor reversal.
This isn’t a history lesson. It’s a survival guide. By the end, you’ll master the candlestick patterns that matter—and dodge the ones that lie. Let’s light this candle.
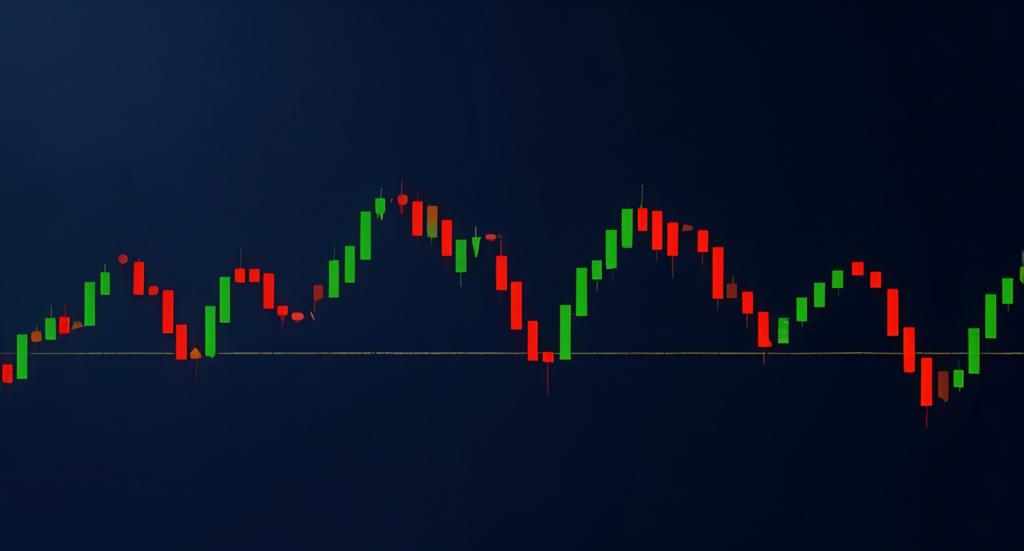
1. What Are Candlestick Patterns? (And Why They Work)
Candlestick patterns are visual snapshots of market emotion. Born in 18th-century Japan, they reveal battles between bulls (buyers) and bears (sellers). Each candle has four parts:
- Open/Close: The body shows where prices started and ended.
- High/Low: The wicks (shadows) mark the session’s extremes.
Why they’re powerful:
- They compress hours of trading into a single visual.
- They expose hidden support/resistance levels.
- They work in any market: stocks, crypto, even Pokémon cards.
Pro tip: Ignore single candles. Candlestick patterns need confirmation (2-3 candles) to matter.
2. The Hammer & Hanging Man: The Ultimate Reversal Duo
These candlestick patterns look identical but signal opposite outcomes.
The Hammer (Bullish Reversal)
- Appearance: Small body, long lower wick (2-3x the body).
- Where: After a downtrend.
- Psychology: Sellers tried to crush prices, but buyers fought back.
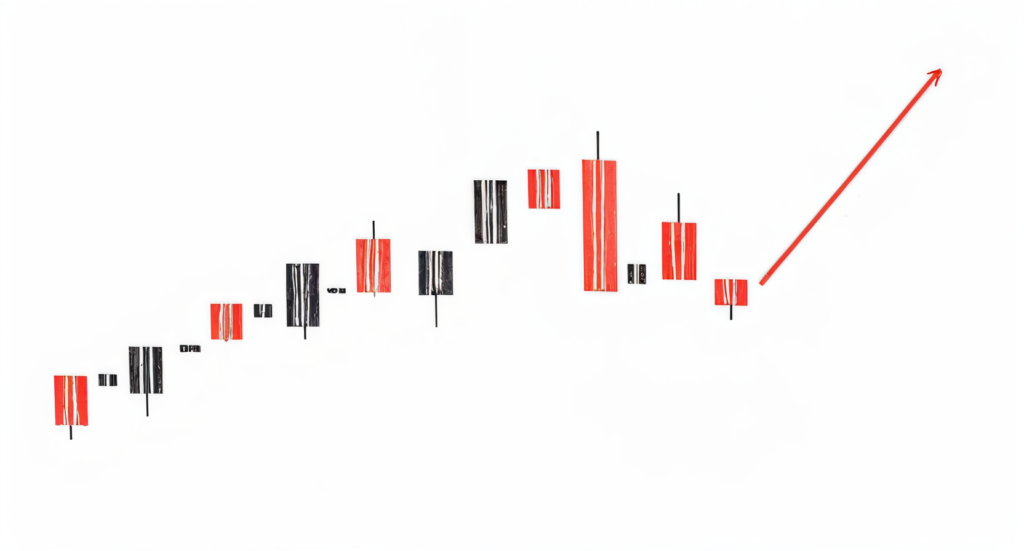
Trade it: Buy at the close, set a stop-loss below the wick.
Real example: Bitcoin formed a hammer at $16K in December 2022, then rallied 200% in 6 months.
The Hanging Man (Bearish Reversal)
- Appearance: Identical to the hammer—but after an uptrend.
- Psychology: Buyers lost control; sellers are lurking.
Trade it: Short or sell, with a stop above the wick.
Case study: Netflix stock flashed a hanging man at $700 in 2021, then crashed 75% in 2022.
3. The Engulfing Pattern: A Market U-Turn
This two-candle candlestick pattern screams, “The trend is over.”
Bullish Engulfing
- Appearance: A green candle swallows the prior red one.
- Where: After a downtrend.
Psychology: Bulls overpowered bears in a single session.
Case study: Amazon stock bullish engulfing in March 2020 marked the COVID crash bottom.
Bearish Engulfing
- Appearance: A red candle engulfs the prior green one.
- Where: After an uptrend.
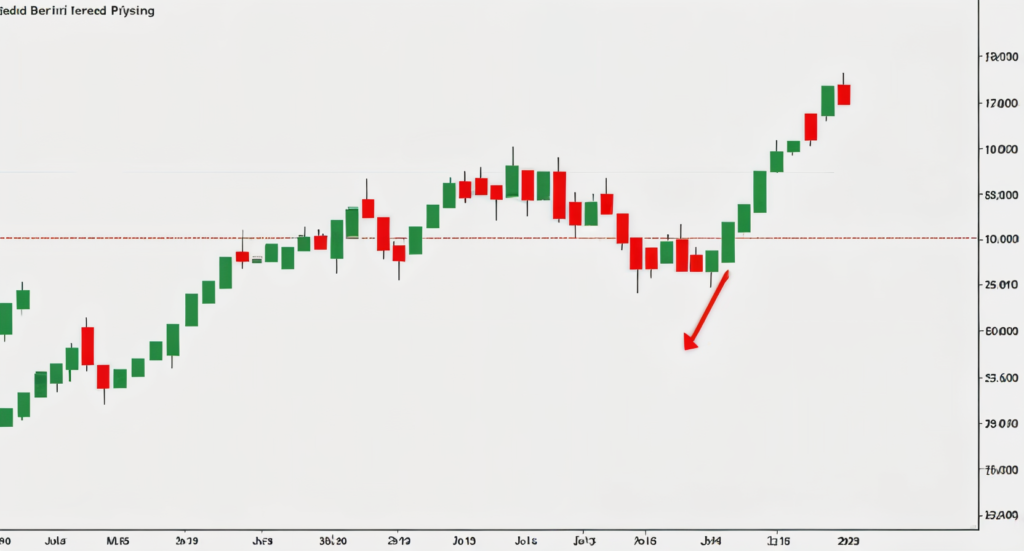
Psychology: Bears ambushed complacent bulls.
Example: Tesla’s bearish engulfing at $400 in 2022 preceded a 60% drop.
Rule: The bigger the engulf, the stronger the signal.
4. The Doji: The Market’s Panic Attack
The doji is the ultimate candlestick pattern of indecision. It looks like a cross (open ≈ close), signaling exhaustion.
Types of Doji:
- Standard: Neutral. Wait for confirmation.
- Dragonfly (Bullish): Long lower wick. Buyers are exhausted but resilient.
- Gravestone (Bearish): Long upper wick. Sellers rejected a rally.
Case study:
- Bitcoin, April 2021: A gravestone doji at $64K signaled the end of its bull run.
- Apple, October 2022: A dragonfly doji at $130 preceded a 40% rally.
Pro tip: Trade dojis only at key support/resistance levels.
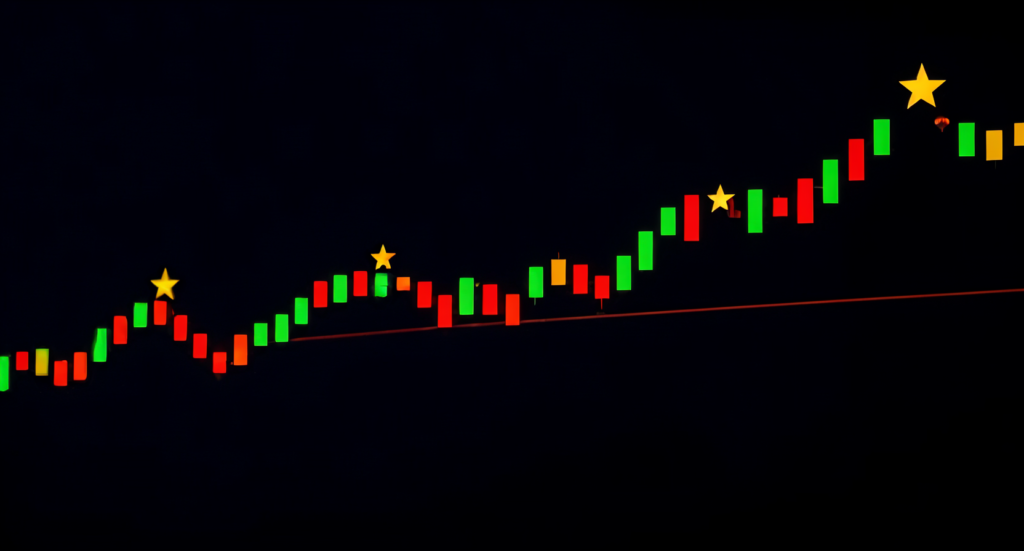
5. The Morning & Evening Stars: Twilight of the Trend
These three-candle candlestick patterns mark major reversals.
Morning Star (Bullish)
- Sequence: Long red → small candle (doji) → long green.
- Psychology: Sellers peak, indecision follows, then bulls dominate.
Example: The S&P 500’s morning star in March 2020 kicked off a 2-year bull market.
Evening Star (Bearish)
- Sequence: Long green → doji → long red.
- Psychology: Bulls tire, bears seize control.
Case study: Ethereum’s evening star at $4,800 in 2021 preceded a 75% crash.
Rule: The middle candle must gap up/down for a valid signal.
The Dark Side: 3 Candlestick Patterns That Lie
Not all candlestick patterns are created equal. Some are traps:
- The Shooting Star (Fake Bullish):
- Looks like a bullish hammer but forms after a rally.
- Example: GameStop’s 2021 shooting star lured FOMO buyers before a 90% crash.
- The Marubozu (False Confidence):
- A candle with no wicks, signaling extreme control.
- Risk: A red marubozu in an uptrend can reverse hard.
- The Spinning Top (Noise):
- Small body, equal wicks. Indicates indecision, not reversal.
- Ignore unless paired with volume spikes.
How to Trade Candlestick Patterns Like a Pro
- Wait for Confirmation: A hammer means nothing until the next candle closes higher.
- Mix with Indicators: Use RSI or MACD to validate candlestick patterns.
- Respect Timeframes: Daily patterns > hourly noise.
- Backtest: Check how a pattern performed in past market conditions.
Toolkit:
- TradingView (free pattern scanner).
- Investopedia’s Candlestick Guide.
Psychology Behind Candlestick Patterns: Fear, Greed, and Herds
Candlestick patterns work because humans are predictable:
- FOMO: Green candles lure buyers like moths to flames.
- Panic: Long red candles trigger primal fear.
- Herd Mentality: Engulfing patterns signal mass sentiment shifts.
Case study: The 2020 COVID crash saw consecutive bearish engulfing patterns as panic spread.
5 Deadly Mistakes New Traders Make
- Chasing Tails: Buying every hammer, ignoring context.
- Ignoring Volume: A bullish pattern with low volume is a fakeout.
- Overcomplicating: Stacking 10 patterns on one chart.
- Forgetting Fundamentals: Candlesticks can’t predict earnings or Fed moves.
- No Stop-Losses: Letting losses run because “the pattern will work.”
The Future of Candlestick Patterns: AI vs. Humans
Hedge funds now use AI to scan millions of candlestick patterns for statistical edges. But machines lack intuition.
Your edge: Combine patterns with market narrative (e.g., a bullish hammer during Fed rate cuts).
Final Word: Candlestick Patterns Are Your Secret Weapon
Candlestick patterns aren’t crystal balls—they’re time-tested tools to tilt odds in your favor. Master these five signals, avoid the traps, and you’ll trade not just with charts, but with the market’s pulse.
Your move: Pick one pattern, paper-trade it for a month, and prove it works. The market’s stories are waiting.
Written with a mix of reverence and rebellion—because in trading, rules are made to be bent, not broken.