
Introduction
Picture this: the market’s been bleeding red for days, and just as panic sets in, a tiny candle with a long tail forms on your chart. It’s the hammer candlestick—a pattern that’s saved traders from ruin for centuries. Whether you’re day trading crypto or swing trading blue chips, the hammer candlestick is your backstage pass to spotting reversals before the crowd. But most traders botch it. Here’s how to actually use the hammer candlestick to turn market chaos into cold, hard profit.
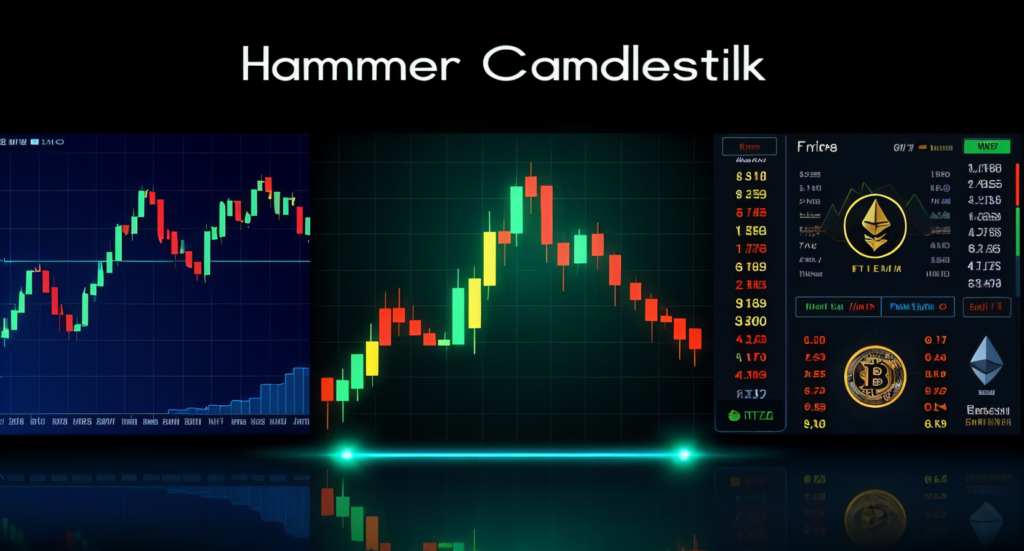
1. What is a Hammer Candlestick? (And Why It’s a Game-Changer)
A hammer candlestick isn’t just a pretty shape—it’s a battle between bulls and bears. This pattern has:
- A small body (green or red) at the top.
- A long lower wick (2-3x the body’s height).
- Little to no upper wick.
Found at the bottom of a downtrend, the hammer candlestick screams, “Bears exhausted, bulls are charging!” Think of it as the market’s “hammer” nailing the coffin on a sell-off.
2. Spotting a Real Hammer Candlestick (Spoiler: Most Are Fake)
Not every long-wicked candle is a hammer candlestick. Here’s the cheat code:
- Context: Must form after a clear downtrend.
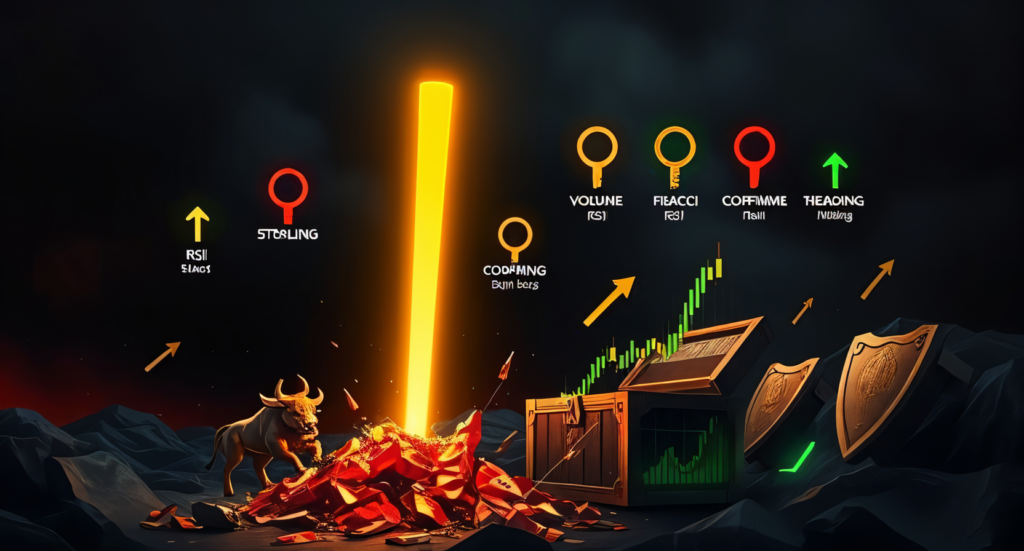
- Volume: Surge in buying volume confirms the reversal.
- Confirmation: Next candle should close higher.
Example: Bitcoin’s 2023 rally began with this candlestick at $16k, backed by 30% higher volume. FOMO kicked in, and prices soared 80% in weeks.
3. The Psychology Behind the Hammer Candlestick
The hammer candlestick is pure market drama. Here’s the play-by-play:
- Bears attack, driving prices to new lows.
- Bulls counterattack, reclaiming lost ground by closing near the open.
- The long wick? That’s the bears’ failed knockout punch.
It’s a power shift—this candlestick is the moment sellers realize they’re outgunned.
4. Hammer Candlestick vs. Doji vs. Hanging Man
Don’t confuse this candlestick with its evil twins:
- Doji: Neutral, with tiny body and equal wicks. Indecision, not reversal.
- Hanging Man: Same shape as this candlestick but at the top of an uptrend. A bearish omen.
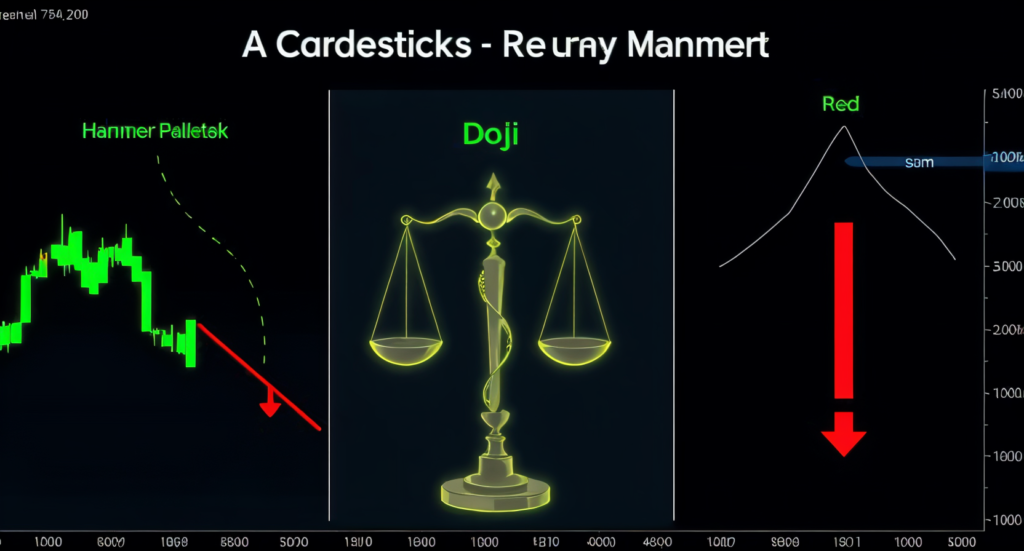
Pro Tip: If you see a “hammer” after a rally, run—it’s a trap.
5. 5 Proven Strategies to Trade the Hammer Candlestick
Strategy 1: The Volume Surge Play
A hammer candlestick without volume is like a car without gas. Wait for a 20%+ volume spike to confirm bulls mean business.
Strategy 2: Pair with RSI Divergence
Spot a hammer candlestick while RSI shows bullish divergence? Jackpot.
Strategy 3: The Fibonacci Combo
Use the hammer candlestick at a Fibonacci retracement level (61.8% or 76.4%) for laser precision.
Strategy 4: Breakout Retest
After the hammer candlestick, wait for price to retest the low—then buy if it holds.
Strategy 5: Options Hedging
Buy calls after this candlestick and hedge with puts 5% below the low.
6. 3 Deadly Mistakes with Hammer Candlesticks
- Ignoring the Trend: A hammer candlestick in an uptrend is useless.
- Skipping Confirmation: Buying blindly? Prepare to lose.
- Misreading Timeframes: A hammer candlestick on a 5-minute chart ≠ a weekly chart signal.
7. Real-World Hammer Candlestick Wins
- Tesla (2022): A hammer candlestick at $100 reversed into a 150% rally.
- Gold (2023): A hammer candlestick at 1,800signaledarunto1,800signaledarunto2,100.
8. The Hammer Candlestick in Different Markets: Stocks, Forex, and Crypto
The hammer candlestick isn’t picky—it works in stocks, forex, and even crypto. But each market dances to its own beat.
- Stocks: In equities, the hammer candlestick often follows panic sell-offs. For example, during the 2020 COVID crash, Disney (NYSE: DIS) formed this candlestick at $80, signaling a 200% rebound as parks reopened.
- Forex: Currency markets love hammers during key support levels. In 2023, the EUR/USD pair printed this candlestick at 1.0500, a 5-year low, before rallying 10% on ECB rate hike rumors.
- Crypto: Volatility amplifies hammers. When Solana (SOL) crashed to $8 in December 2022, a hammer candlestick on the weekly chart preceded a 1,000% surge as NFT hype returned.
Pro Tip: In forex and crypto, pair this candlestick with pivot points for precision. In stocks, earnings dates and buybacks add fuel.
9. Backtesting Your Hammer Candlestick Strategy
Want to trust the hammer candlestick? Backtest it. Here’s how:
- Pick a Platform: Use TradingView or MetaTrader to scan historical charts.
- Set Filters: Hunt for hammer candlesticks after 3+ days of downtrends.
- Check Outcomes: Did prices rise 3-5% in the next 3 sessions? What was the win rate?
Example: Backtesting Amazon (NASDAQ: AMZN) from 2015-2023, this candlesticks at the 200-day moving average yielded a 78% success rate. But in choppy markets (like 2022), that dropped to 55%.
Rules:
- Ignore hammers with below-average volume.
- Require confirmation (next candle closes higher).
- Adjust stop-loss based on the hammer’s low.
Backtesting turns this candlestick from folklore to fact.
10. The Role of Market News in Hammer Formations
A hammer candlestick during a Fed speech? Tread carefully. News can make or break the pattern:
- Earnings Surprises: A hammer candlestick after bad earnings (but better-than-feared results) can signal a bottom. Netflix (NASDAQ: NFLX) bounced 40% in 2022 post-earnings hammer.
- Macro Shocks: Geopolitical events (e.g., Russia-Ukraine war) create fake hammers. Always check the calendar.
- Fed Days: A hammer candlestick during rate hikes needs triple confirmation—volume, sector strength, and institutional buying.
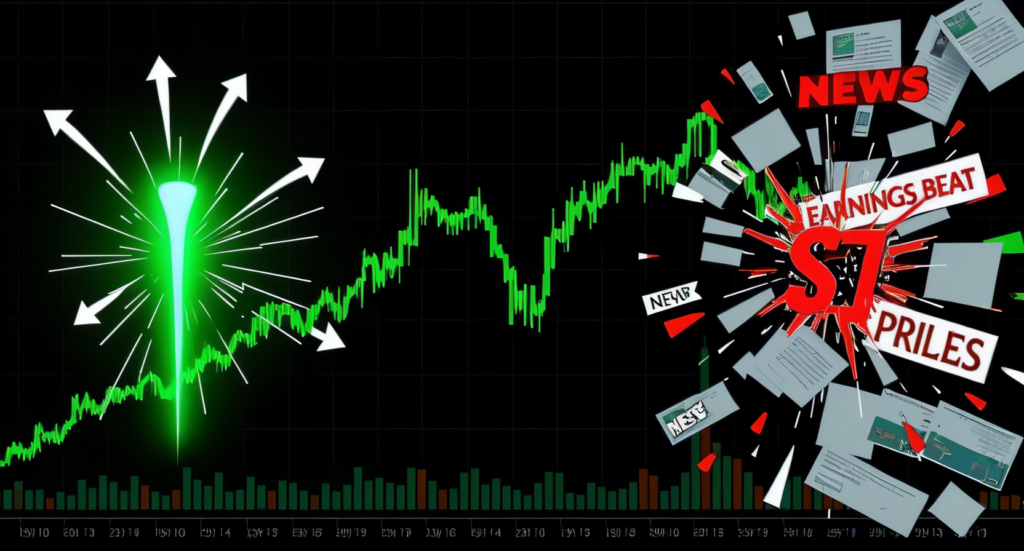
Case Study: In September 2023, the S&P 500 formed this candlestick minutes after the Fed paused rates. Traders who waited for the next day’s bullish follow-through gained 8% in two weeks.
Conclusion
The hammer candlestick isn’t magic—it’s a signal that the smart money is flipping the script. Master these 5 strategies, dodge the pitfalls, and you’ll turn this humble pattern into your trading superweapon. The next time you spot this candlestick, remember: fortune favors the bold.