
Let’s cut through the noise: In a world of AI trading bots and quantum computing, a 16th-century rice trader’s invention still dominates Wall Street. That invention? Candlestick charts—the colorful, cryptic bars that predict market moves better than most hedge funds.
But here’s the problem: 90% of new traders use candlesticks wrong. They chase “bullish engulfing” patterns like kids chasing ice cream trucks, only to get flattened by a market reversal.
This isn’t just a history lesson. It’s a survival guide. By the end, you’ll decode candlesticks like a pro, spot traps before they snap shut, and maybe even outsmart the algorithms. Let’s light this candle.
The Samurai Who Invented Candlesticks (And Why It Matters)
Picture 18th-century Japan. Rice trader Honma Munehisa stares at handwritten price logs, desperate to outwit Osaka’s cutthroat markets. He notices patterns in the chaos—swings in supply, demand, and human emotion. To visualize them, he creates the first candlestick charts, using them to monopolize Japan’s rice trade and amass a fortune worth $10 billion today.
Fast-forward to 1989: American analyst Steve Nison stumbles on Homma’s work, publishes Japanese Candlestick Charting Techniques, and Wall Street loses its mind. Suddenly, every trader from New York to Mumbai is obsessing over “hammers,” “shooting stars,” and “dojis.”
Why candlesticks endure:
- They compress price action into visual stories.
- They reveal market psychology (fear, greed, indecision).
- They work in any market: crypto, stocks, even Pokémon cards.
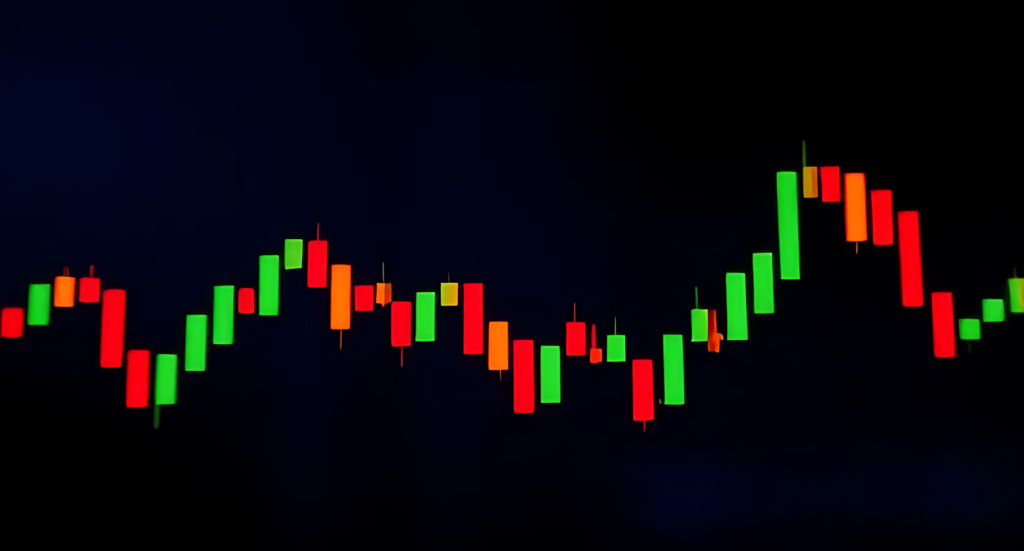
Candlestick Anatomy 101: The Body, Wick, and Soul
Every candlestick is a battlefield. The body, wicks (or shadows), and colors tell you who’s winning: buyers (bulls) or sellers (bears).
1. The Body
- Bullish candlestick (green/white): Prices closed higher than they opened. Buyers are in control.
- Bearish candlestick (red/black): Prices closed lower. Sellers rule.
2. The Wicks
- Upper wick: The day’s high. Shows where sellers slammed the door on buyers.
- Lower wick: The day’s low. Reveals where buyers stepped in to halt a crash.
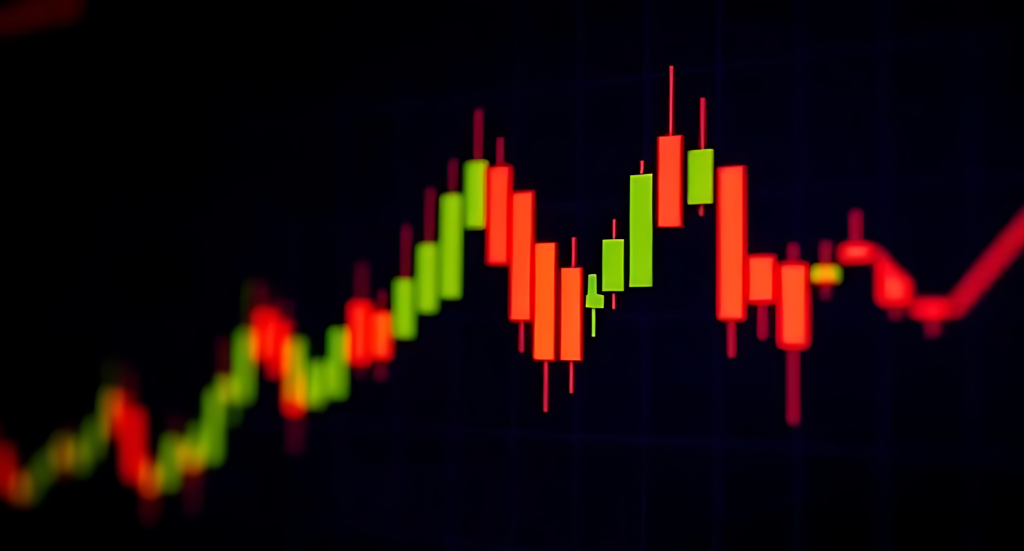
3. The Soul
Candlesticks don’t just show numbers—they scream emotions. A long red body? Panic. A tiny body with huge wicks? Indecision.
7 Deadly Candlestick Patterns (And How to Trade Them)
1. The Hammer: The Market’s Rejection Letter
- Looks like: A candlestick with a tiny body and long lower wick.
- Meaning: Sellers tried to crash prices, but buyers fought back.
- Trade it: Buy at the close, set a stop-loss below the wick.
Real example: Bitcoin formed a hammer at $16,000 in December 2022, then rallied 200% in 6 months.
2. The Doji: The Trader’s Panic Attack
- Looks like: A cross (open ≈ close).
- Meaning: Buyers and sellers are deadlocked.
- Trade it: Wait for confirmation. A doji after a rally often signals a reversal.
Pro tip: A “dragonfly doji” (long lower wick) screams bullish exhaustion.
3. Engulfing Pattern: The Market’s U-Turn
- Bullish engulfing: A green candlestick swallows the previous red one.
- Bearish engulfing: Red swallows green.
- Meaning: A violent shift in control.
Trade it: Enter on the close of the engulfing candle.
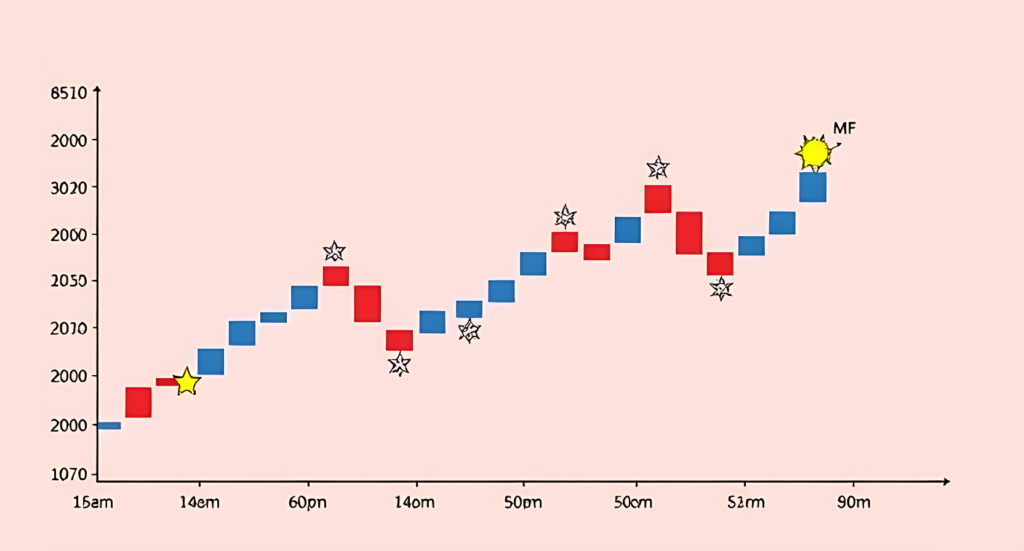
4. Morning Star/Evening Star: The Market’s Jet Lag
- Morning Star: Red → small body (doji) → green. Bullish reversal.
- Evening Star: Green → doji → red. Bearish reversal.
- Meaning: The calm before the storm.
Real example: Apple’s 2023 crash began with an evening star after earnings.
5. Shooting Star: The Bull Trap
- Looks like: A candlestick with a long upper wick and tiny body.
- Meaning: Buyers got overexcited, then sellers crushed them.
- Trade it: Short with a stop above the wick.
6. Marubozu: The Ruthless Trend
- Bullish marubozu: Green with no wicks.
- Bearish marubozu: Red with no wicks.
- Meaning: One-sided domination.
Trade it: Ride the trend until the marubozu breaks.
7. Three Black Crows/Three White Soldiers: The Gang War
- Three Black Crows: Three red candles with lower closes.
- Three White Soldiers: Three green candles with higher closes.
- Meaning: A relentless trend.
Real example: Three White Soldiers signaled the start of NVIDIA’s 2023 AI rally.
Why Candlesticks Beat Bar Charts (And Your Gut)
Bar charts show the same data as candlesticks—but they’re as exciting as oatmeal. Here’s why candlesticks win:
- Visual clarity: Candlesticks turn numbers into art. A “hanging man” pattern jumps out; a bar chart’s just noise.
- Emotional insight: Candlesticks expose fear (long wicks) and greed (marubozu).
- Speed: You scan 100 candlesticks faster than 100 bars.
Case study: In 2021, GameStop’s candlestick charts flashed “bullish engulfing” days before Reddit’s army noticed.
The Dark Side of Candlesticks: 3 Traps That Wreck Newbies
1. Overfitting the Past
Just because a hammer worked for Bitcoin doesn’t mean it’ll work for Dogecoin. Markets have personalities.
2. Ignoring Context
A doji during a Fed announcement means nothing. A doji after a 10-day rally? Everything.
3. Chasing Perfection
Not every hammer leads to a rally. Use stop-losses, or you’ll bleed out.
Candlesticks + Algorithms: The Unbeatable Combo
Hedge funds now merge candlesticks with AI. For example:
- Pattern recognition: AI scans millions of candlesticks for statistical edges.
- Sentiment analysis: AI links candlestick patterns to news headlines.
DIY version: Use TradingView’s candlestick pattern scanner + a Twitter sentiment tool.
How to Practice Candlesticks (Without Losing Money)
- Paper trade: Use a demo account to test patterns.
- Backtest: Check how a “shooting star” performed in 2020’s crash.
- Journal: Note why a candlestick trade worked/failed.
Pro tip: Start with weekly candlesticks—they’re less noisy than daily.
The Future of Candlesticks: From Metaverse to Mars
Candlesticks aren’t going extinct. They’re evolving:
- NFT markets: Traders use candlesticks to track Bored Ape prices.
- Space stocks: When SpaceX IPOs, candlesticks will chart its volatility.
Conclusion: Candlesticks Are Your Time Machine
Munehisa Homma’s rice charts still work because humans haven’t changed. We’re still greedy, fearful, and terrible at predicting the future. Candlesticks don’t just predict prices—they predict people.
Your move: Stop staring at headlines. Let the candlesticks tell you the story.
Written with a mix of reverence and rebellion—because the best trading tools are the ones that outlive their creators.
Visit My Other Blog Page About AI Stocks